


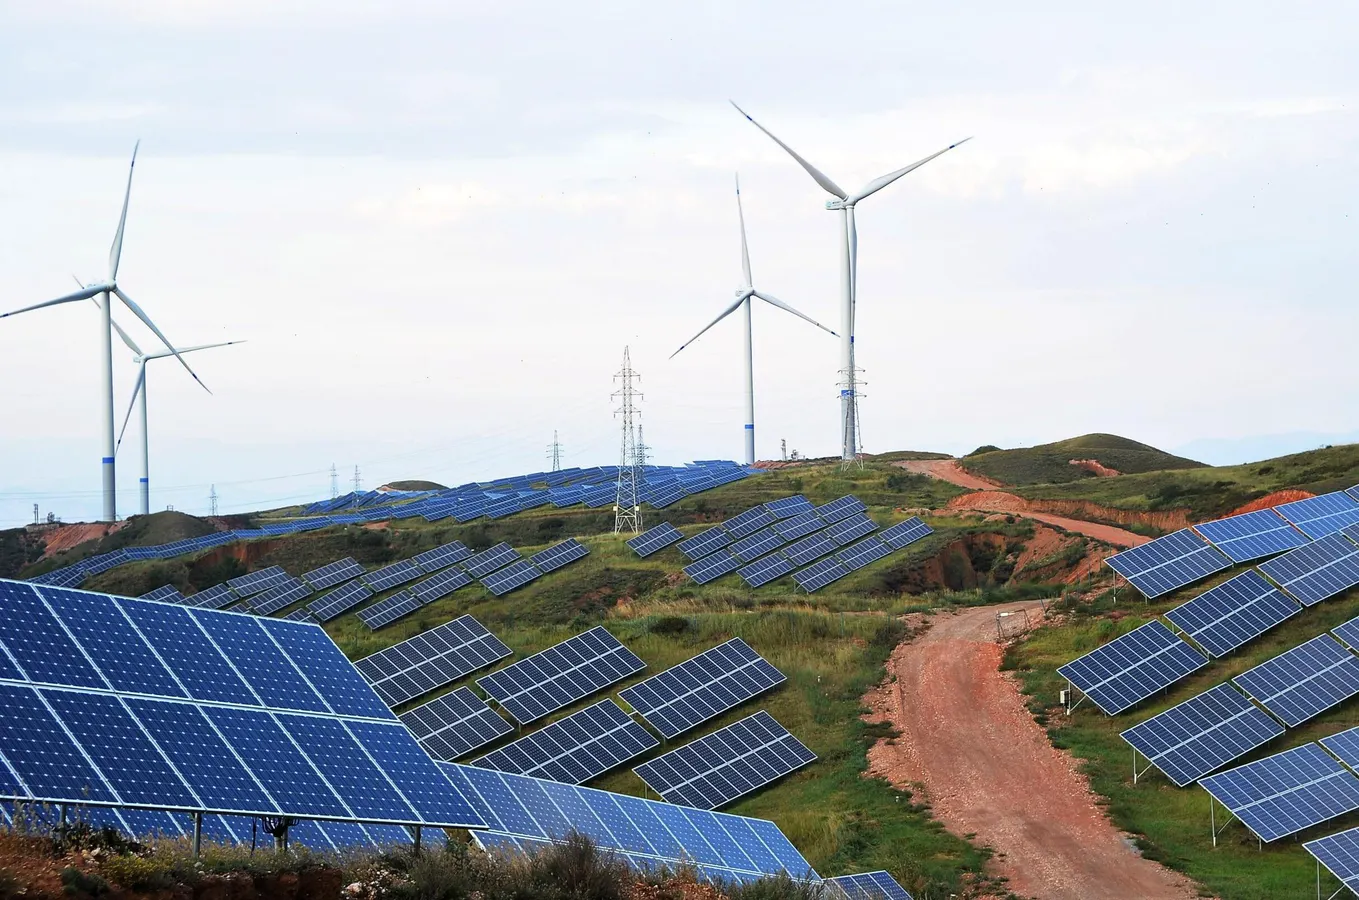

ZHANGJIAKOU, CHINA – JULY 02: Solar panels and wind turbines are pictured on a barren mountain at Shenjing Village on July 2, 2018 in Zhangjiakou, Hebei Province of China. The installed capacity of renewable energy electricity generation in Zhangjiakou has reached 12.03 million kilowatts. (Photo by VCG)
VCG via Getty Images
In 2007, nearly two decades ago, I wrote an article called “The Future Is Solar.” At the time, my argument was largely based on efficiency. I had been comparing biofuels with direct solar energy and noted how much more effectively solar panels could capture the sun’s energy than crops could convert it into liquid fuel. Solar was still expensive, storage was a major challenge, and the world’s energy infrastructure was built around fossil fuels. But the direction seemed clear.
It has been a long time coming, but the numbers now make it increasingly difficult to argue that the solar future is still some distant prospect. It is arriving in real time.
The latest Statistical Review of World Energy shows just how dramatically the renewable landscape has changed. Solar generation surged again in 2025 and, for the first time, surpassed wind as a source of global electricity. Hydropower remains the largest renewable source overall, but solar is now the fastest-growing major component of the world’s renewable power supply.
Global Renewable Energy Consumption Has Accelerated.
Robert Rapier
Renewables Reach One-Third Of Global Electricity
Worldwide electricity generation reached about 32,202 terawatt-hours (TWh) in 2025. Hydroelectricity, wind, solar, and other renewable sources combined generated approximately 10,749 TWh.
That means renewables supplied about 33.4% of global electricity.
Hydroelectric power remained the largest contributor at 4,479 TWh, accounting for 13.9% of worldwide electricity generation. Solar reached 2,811 TWh, or 8.7% of the global total, while wind generated 2,714 TWh, or 8.4%. Geothermal, biomass, and other renewable sources contributed another 745 TWh, representing 2.3%.
The bigger story is the rate at which those numbers are changing. Total renewable generation increased 9.1% in 2025. But virtually none of the major renewable categories grew at the same pace.
Solar generation jumped 30.1%. Wind increased 8.2%. Other renewables grew 2.8%, while hydroelectric generation edged up just 0.4%.
Measured by the actual increase in electricity generated, solar accounted for nearly three-quarters of the growth in renewable electricity during the year.
Solar Passes Wind
Perhaps the most striking milestone in the new data is that solar generated more electricity than wind for the first time.
As recently as 2015, global wind generation was more than three times solar generation. Wind produced 832 TWh that year compared with just 257 TWh from solar.
A decade later, wind generation had more than tripled to 2,714 TWh. But solar output increased almost elevenfold, reaching 2,811 TWh.
Solar’s acceleration has been especially dramatic over the past several years. It generated just 1,061 TWh in 2022. Three years later, output was more than 2.6 times that level.
The Energy Institute highlighted solar as the fastest-scaling renewable technology in its 2026 review, noting that solar accounted for 71% of the increase in renewable total energy supply during 2025.
China dominates this market. It generated about 1,173 TWh of solar electricity in 2025, representing nearly 42% of the global total. U.S. solar generation ranked second at 393 TWh, followed by India at 169 TWh, Japan at 111 TWh, and Germany at 92 TWh.
China’s solar generation increased another 40% in 2025. U.S. output grew 28%, while India’s increased 23%.
These are extraordinary growth rates for technologies already operating at large scale.
Wind Keeps Growing, But At A Slower Pace
Wind’s trajectory is less spectacular, but it remains an enormous source of electricity.
Global wind generation reached 2,714 TWh in 2025, up 8.2% from the previous year. China again dominated, generating 1,128 TWh, or nearly 42% of the world total.
The U.S. was a distant second at 469 TWh. Germany generated 134 TWh, followed by Brazil at 116 TWh and India at 104 TWh.
The geographic pattern is noteworthy. China’s wind output increased 13.4% in 2025, while India’s jumped nearly 28%. Brazil increased almost 8%. In contrast, wind generation declined in several mature European markets, including Germany and Spain.
Wind is still growing globally, but solar has clearly become the faster engine of renewable expansion.
Together, solar and wind produced about 5,525 TWh in 2025, representing 17.2% of all electricity generated worldwide. Their combined output was also about 23% greater than global hydroelectric generation.
Hydropower Remains The Giant
Solar may be growing fastest, but hydroelectricity shouldn’t be overlooked. At 4,479 TWh, hydro still generated substantially more electricity than either wind or solar individually.
What distinguishes hydro is maturity.
Global hydroelectric generation was already 3,880 TWh in 2015. It has increased only about 15% over the subsequent decade, compared with a 226% increase for wind and nearly a 1,000% increase for solar.
China is also the world’s dominant hydroelectric producer, generating 1,392 TWh in 2025. Brazil ranked second at 398 TWh, followed by Canada at 348 TWh, the U.S. at 244 TWh, and Russia at about 200 TWh.
Hydropower can also vary significantly from year to year because rainfall, snowpack, and reservoir conditions affect output. Brazil’s hydroelectric generation, for example, fell 5.4% in 2025, even though Brazil remains one of the world’s largest hydro producers.
This illustrates an important distinction between capacity and generation. A hydroelectric system doesn’t necessarily produce the same amount of electricity every year simply because its installed capacity hasn’t changed.
The Smaller Renewable Categories
The Statistical Review groups geothermal, biomass, and several smaller renewable technologies together. These sources generated about 745 TWh globally in 2025, up 2.8% from the previous year.
China again led at approximately 137 TWh, followed by the U.S. at 65 TWh and Brazil at 62 TWh. Germany and Japan each generated about 48 TWh.
These technologies remain significant in particular countries and regions, but globally they are growing much more slowly than solar and wind. Their combined generation has increased from 527 TWh in 2015 to 745 TWh in 2025, a gain of about 41%.
Biofuels Tell A Different Story
Biofuels have to be considered separately because they primarily compete in transportation fuels rather than electricity generation. The Statistical Review reports biofuel consumption in barrels of oil equivalent rather than TWh.
Global biofuel consumption reached about 2.28 million barrels of oil equivalent per day in 2025, essentially unchanged from 2024.
But beneath that flat headline were significant shifts.
Biogasoline, which includes fuels such as ethanol, grew 7% to approximately 1.27 million barrels of oil equivalent per day. Biodiesel consumption fell nearly 7% to approximately 1.01 million barrels per day.
The U.S. remained the world’s largest biofuel consumer at about 749,000 barrels of oil equivalent per day, although consumption fell 11% in 2025. Brazil ranked second at about 540,000 barrels per day, up nearly 10%. Indonesia ranked third at 197,000 barrels per day, while India posted one of the largest percentage gains among major consumers, increasing almost 40% to 111,000 barrels per day.
Unlike solar electricity, biofuels are therefore not experiencing a uniform global boom. Their prospects depend heavily on transportation policy, blending requirements, feedstock availability, vehicle technology, and regional fuel markets.
Renewable Growth Is Not Yet Fossil Fuel Displacement
There is an important qualification to all of this impressive renewable growth. In 2025, renewable energy supply increased by about 3.2 exajoules. But total global energy demand increased by roughly 8.1 exajoules.
In other words, renewables supplied only about 40% of the increase in global energy demand. They are growing rapidly, but global energy consumption is growing even faster. As a result, the expansion of renewables is still primarily adding new energy supply rather than displacing existing fossil fuel consumption.
This is an important distinction in discussions about the energy transition. Solar can grow 30% in a year, wind can continue setting records, and renewables can capture an increasing share of the electricity market, while global fossil fuel consumption still rises. For fossil fuel use to begin declining on a sustained basis, low-carbon energy growth ultimately has to exceed the growth in overall energy demand by enough to begin replacing existing coal, oil, and natural gas consumption.
A Transition Moving At Different Speeds
The 2025 data therefore tell two stories at once. Renewable adoption is unquestionably accelerating, led overwhelmingly by solar. But rising global energy demand continues to absorb much of that new supply. The future I envisioned nearly two decades ago is arriving, but for now it is being layered on top of the existing energy system more than replacing it.
Hydropower remains the largest source of renewable electricity but is growing slowly. Wind is still expanding at a healthy rate. Solar has entered an entirely different growth regime and has now surpassed wind in annual generation. Other renewable technologies continue to contribute, but on a much smaller scale. Biofuels are mature in some markets and growing rapidly in others.
Taken together, renewables now produce roughly one-third of the world’s electricity. But the composition of that one-third is changing quickly.
If the trends of the past decade continue, the renewable electricity mix of 2035 will look very different from the one we see today.
















Leave a comment